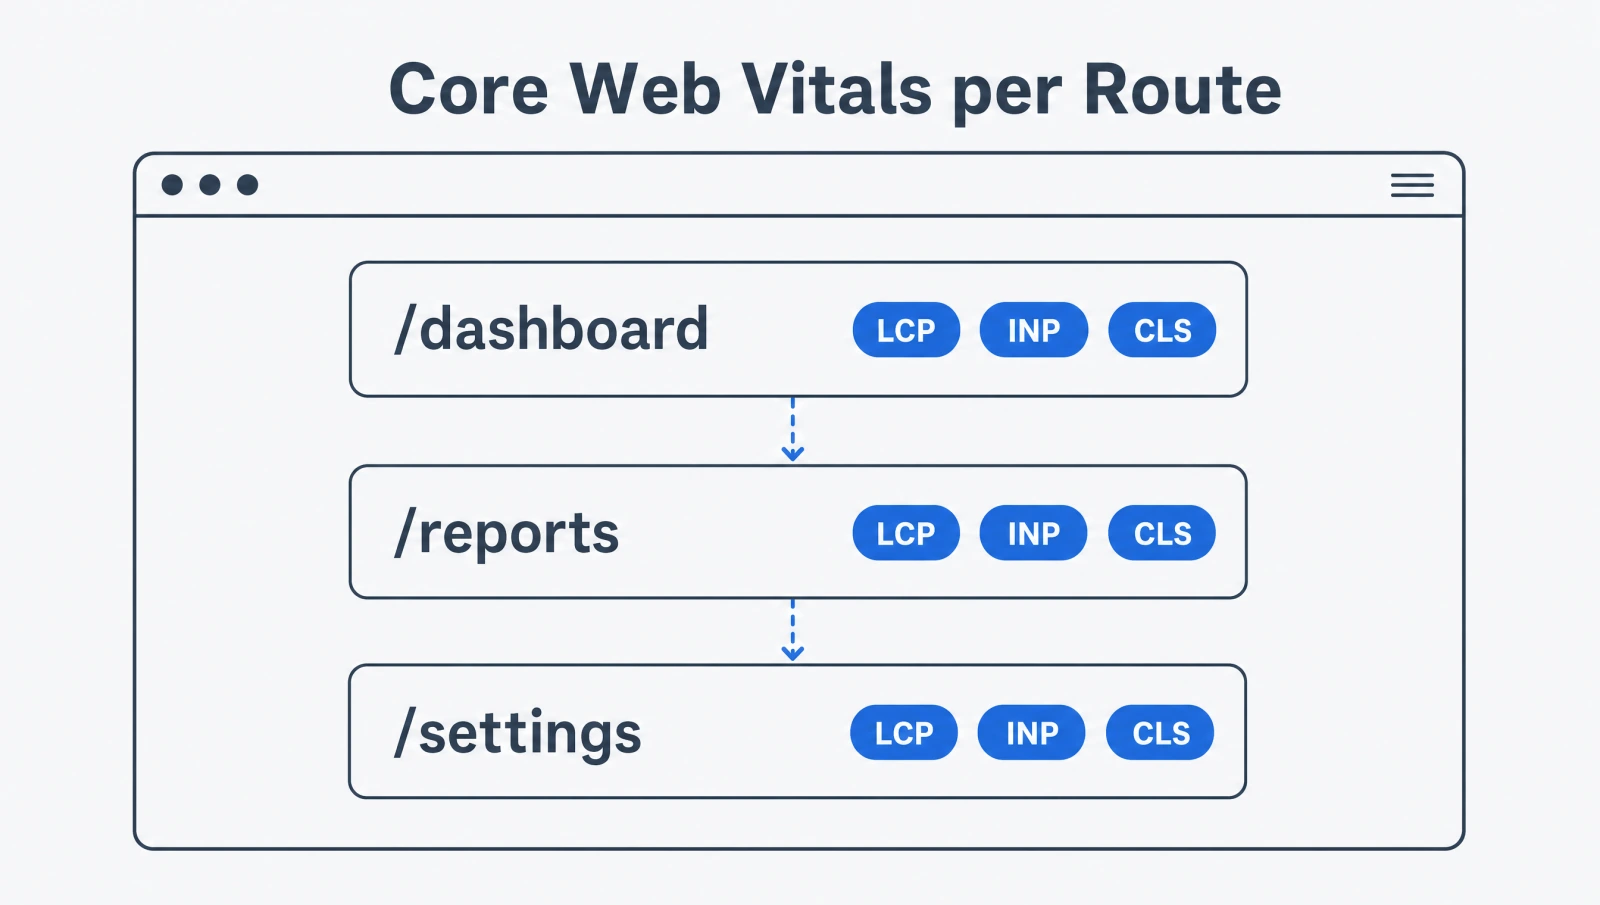

Here is a bug that does not throw an error, does not show up in your logs, and quietly makes your performance dashboard lie to you. Your single-page app loads fast on the landing route, so your Core Web Vitals look green. Then a user clicks into a deep route, waits two seconds for a chart to paint, and your monitoring never records it.
I hit this on a React dashboard last year. The initial load scored a clean LCP of 1.4s. Real users on the reports page were staring at spinners for 3 seconds, and our RUM tool showed nothing wrong, because in a single-page app the browser only ever fires one navigation. Every route change after that is invisible to the performance timeline.
Chrome's Soft Navigations API fixes this. It teaches the browser to recognize a client-side route change as a real page view, then attributes LCP, INP, and CLS to that specific route. This post walks through what a soft navigation is, how to turn the API on, how to wire it into PerformanceObserver and the web-vitals library, and how to read the per-route numbers. If you have ever wondered why your SPA metrics felt too good, this is the missing piece. It pairs well with the work I did on moving data fetching off useEffect, since slow route data is the usual reason a soft navigation scores badly.
Why are Core Web Vitals invisible in a single-page application?
Core Web Vitals are invisible on SPA route changes because the browser ties every metric to a single navigation event, and a client-side route change never fires one. When your router swaps the view with history.pushState and a DOM update, the browser sees the same document it loaded minutes ago. LCP was already finalized on first paint. CLS keeps summing layout shifts across the whole session. INP is the only one that survives, and even it has no idea which route the slow interaction belonged to.
So you end up with a metric that describes the first thing a user saw and ignores everything after. For a content site with full page loads, that is fine. For a SPA where users spend 90% of their time on routes they reached by clicking, it is close to useless.
The traditional workarounds were all bad. Some teams manually called performance.mark() on every route change and computed their own timings, which misses the actual paint and interaction signals the browser tracks internally. Others gave up and reported only the initial load, accepting the blind spot. Neither gives you the real LCP element or the real interaction latency for a route.
What you actually want is for the browser to reset its Core Web Vitals accounting at each route change, the same way it would on a multi-page site. That is exactly what soft navigations provide.
What is a soft navigation, and how does Chrome detect one?
A soft navigation is a client-side route change that Chrome recognizes as a new logical page view based on a heuristic. The browser cannot read your router's mind, so it watches for a specific pattern of three things happening together.
All three conditions must hold:
- A user action initiates the navigation. A click or a keypress, not a background timer or a fetch that resolves on its own.
- The URL changes visibly. Through
history.pushState,history.replaceState, or a direct History API call that updates what the user sees in the address bar. - The interaction produces a visible paint. New content has to actually render, so a no-op route that changes the URL but paints nothing does not count.
That heuristic is deliberately conservative. Chrome would rather miss a borderline navigation than wrongly split one page view into two and corrupt your numbers. The replaceState trigger was added to the final origin trial after developer feedback, because plenty of routers use replaceState for things like filter changes that users perceive as navigations.
The important detail for instrumentation: once Chrome flags a soft navigation, it stamps a unique navigationId onto the performance entries that follow. That id is the thread you pull on to group LCP, CLS, and interaction entries by route.
How do you turn on the Soft Navigations API in Chrome?
You enable the Soft Navigations API one of two ways depending on whether you want local testing or real field data. For local work, flip a flag. For production measurement, join the origin trial.
For local testing, enable the Chrome flag:
chrome://flags/#soft-navigation-heuristicsOr launch Chrome from the command line with the feature turned on:
# macOS
/Applications/Google\ Chrome.app/Contents/MacOS/Google\ Chrome \
  --enable-features=SoftNavigationHeuristics

# Linux
google-chrome --enable-features=SoftNavigationHeuristicsFor field data from real users, register your origin in the Soft Navigations origin trial. It runs from Chrome 147 through Chrome 149, with a stable launch expected later in 2026. Once you have a token, add it as a meta tag in your document head:
<meta http-equiv="origin-trial" content="YOUR_ORIGIN_TRIAL_TOKEN" />Or send it as an HTTP response header, which is the better choice for a SPA because the token applies before your JavaScript runs:
Origin-Trial: YOUR_ORIGIN_TRIAL_TOKENEither way, the API surface is identical. The flag is for your own Chrome during development. The token is what lets the feature run for visitors who have not enabled any flags, so your real-user monitoring actually collects data.
How do you observe soft navigations with PerformanceObserver?
You observe soft navigations by registering a PerformanceObserver for the soft-navigation entry type. Each entry that arrives represents one detected route change, carrying the new URL and a navigationId you use to correlate other metrics.
Always feature-detect first so you do not throw on browsers without the API:
function supportsSoftNavigations() {
  return (
    typeof PerformanceObserver !== 'undefined' &&
    PerformanceObserver.supportedEntryTypes.includes('soft-navigation')
  );
}

if (supportsSoftNavigations()) {
  const observer = new PerformanceObserver((list) => {
    for (const entry of list.getEntries()) {
      console.log('Soft navigation to', entry.name);
      console.log('navigationId', entry.navigationId);
      console.log('started at', entry.startTime);
    }
  });

  observer.observe({ type: 'soft-navigation', buffered: true });
}The buffered: true option matters. It replays entries that fired before your observer registered, which is common in a SPA where your analytics code loads after the first interaction. Without it you would miss early route changes.
Each soft-navigation entry gives you a few useful fields:
nameis the new URL the navigation resolved to.navigationIdis the unique key for grouping all metrics from this route.startTimeis when the initiating interaction happened.largestInteractionContentfulPaintpoints at the largest paint that resulted from the navigation, the soft-nav equivalent of LCP.
That navigationId is the whole game. Every Core Web Vital entry that follows a soft navigation gets the same id, so you can finally answer "how slow was the reports route specifically" instead of "how slow was the session."
How do you attribute LCP, INP, and CLS to each route?
You attribute each metric to a route by reading the navigationId that Chrome now attaches to standard performance entries after a soft navigation. The largest-contentful-paint, layout-shift, and event entries all gain that field, so grouping by it gives you per-route vitals.
Here is a single observer that buckets metrics by navigation:
const metricsByNavigation = new Map();

function getBucket(navigationId) {
  if (!metricsByNavigation.has(navigationId)) {
    metricsByNavigation.set(navigationId, {
      url: null,
      lcp: 0,
      cls: 0,
    });
  }
  return metricsByNavigation.get(navigationId);
}

const observer = new PerformanceObserver((list) => {
  for (const entry of list.getEntries()) {
    const id = entry.navigationId;
    if (id === undefined) continue;
    const bucket = getBucket(id);

    if (entry.entryType === 'soft-navigation') {
      bucket.url = entry.name;
    }
    if (entry.entryType === 'largest-contentful-paint') {
      bucket.lcp = entry.startTime;
    }
    if (entry.entryType === 'layout-shift' && !entry.hadRecentInput) {
      bucket.cls += entry.value;
    }
  }
});

observer.observe({ type: 'soft-navigation', buffered: true });
observer.observe({ type: 'largest-contentful-paint', buffered: true });
observer.observe({ type: 'layout-shift', buffered: true });The difference this makes is stark once you compare it to the old single-load view.
INP needs one extra note. Interaction entries map to a soft navigation through the interactionId, and the spec guidance is to use interactionId rather than navigationId when you correlate interaction-contentful-paint entries. For most reporting you will let the web-vitals library handle that wiring, which is the next section.
How do you report per-route vitals with the web-vitals library?
You report per-route vitals by using the experimental soft-navigation build of Google's web-vitals library, which exposes a reportSoftNavs option on each metric function. That option tells the library to emit a fresh metric object for every soft navigation instead of one per page load.
Import the soft-navs build and opt in per metric:
import {
  onLCP,
  onINP,
  onCLS,
} from 'https://unpkg.com/web-vitals@soft-navs/dist/web-vitals.js?module';

function sendToAnalytics(metric) {
  // metric.navigationId ties this value to a specific route
  const body = JSON.stringify({
    name: metric.name,
    value: metric.value,
    rating: metric.rating,
    navigationId: metric.navigationId,
  });
  navigator.sendBeacon('/analytics', body);
}

onLCP(sendToAnalytics, { reportSoftNavs: true });
onINP(sendToAnalytics, { reportSoftNavs: true });
onCLS(sendToAnalytics, { reportSoftNavs: true });With reportSoftNavs: true, the callback fires once for the initial load and again for each detected route change, and every metric object carries the navigationId so your backend can group by route. The standard web-vitals v5 build still works for the hard load, but only the soft-navs build resets the metrics per soft navigation.
A few practical notes from wiring this into a real RUM pipeline:
- Use
navigator.sendBeaconor afetchwithkeepalive: trueso the report survives the user leaving the route. - Send the resolved route pattern, not the raw URL, if your routes have ids in them. Reporting
/orders/:idinstead of/orders/8412keeps your dashboard groupable. - Keep the hard-load report too. The first load is still your most important view and you want both in the same dataset.
If you already report Core Web Vitals from a framework like Next.js, you are swapping the import path and adding the reportSoftNavs flag. The shape of your analytics payload barely changes.
How do you read soft navigation data in Chrome DevTools?
You read soft navigation data directly in the Performance panel, which has shown soft-nav markers since Chrome 145. Record a trace, click through a few client-side routes, and DevTools draws a marker at each detected soft navigation so you can see exactly where the browser reset its metrics.
Source: Chrome for Developers
The markers are the fastest way to confirm the heuristic is firing on your routes before you invest in a full RUM integration. If you click a link and no marker appears, one of the three conditions failed. Usually it is the visible-paint requirement, which trips when a route renders from cache so fast that Chrome does not register a contentful paint, or when the URL changed without a user interaction the browser could attribute.
Record the trace, watch for the markers, and line them up against the LCP and layout-shift entries in the same timeline. That visual check has saved me from shipping instrumentation that silently recorded nothing on half my routes.
What are the limits of the Soft Navigations API?
The biggest limit is that this is a heuristic running only in Chromium during an origin trial, so it is a sample and not a complete picture. You need to design your reporting around that from day one rather than treating soft-nav data as ground truth for every user.
The constraints worth planning around:
- Chromium only. Firefox and Safari have no equivalent. Your soft-nav numbers describe Chrome users. Keep your hard-load metrics as the cross-browser baseline.
- It is a heuristic. Routes that paint from cache instantly, or navigations not tied to a clear user interaction, can be missed. The detection favors precision over recall, so expect some false negatives rather than false positives.
- Origin trial status. The API ran as an origin trial through Chrome 149 with a stable launch targeted for later in 2026. Field tokens expire, and the surface could still shift slightly before it ships, though the team froze most of it for this final trial.
- CrUX is undecided. Google has been explicit that this trial is about evaluating the API, not about how the data feeds the Chrome User Experience Report. So do not assume soft-nav vitals will show up in your CrUX dashboard or affect search signals yet.
None of that makes the API less worth adopting. A Chromium-only sample of your real per-route performance is infinitely more than the zero data you have today. Just label it honestly in your dashboards so nobody mistakes a Chrome sample for the whole population.
Is the Soft Navigations API worth adopting now?
Yes, even as an origin trial, because a Chromium-only sample of real per-route performance beats the zero data you have today. The reason this matters goes beyond a nicer dashboard. For years, SPA teams optimized the one route the browser could measure and flew blind on everything else, which quietly trained a generation of apps to be fast on the homepage and slow everywhere that mattered. Per-route Core Web Vitals change the incentive. Once you can see that the settings page has a 4-second LCP, you fix the settings page.
My advice: turn on the flag this week and record a Performance trace of your own app clicking through its three most-used routes. The markers will tell you in 30 seconds whether your performance story is as good as your current metrics claim. I would bet it is not, and that is exactly the point.
For the full specification and reference, see the Soft Navigations API documentation, the final origin trial announcement, and the web-vitals library on GitHub.
Keep Reading
- Why I Replaced useEffect Data Fetching with Server Actions: slow route-change data is the most common reason a soft navigation scores a bad LCP, so this is the upstream fix.
- Building a Modern Documentation Generator with Next.js 16: a practical look at the kind of client-side routing that produces soft navigations in the first place.
- How to Upgrade Next.js for the May 2026 Security Release: keeping your framework current is what gives you access to the newest performance APIs like this one.