
Picture a launch. Traffic doubles in 40 seconds. Your Amazon ECS service is pinned at 95% CPU, requests are queuing, and the auto scaler is just... sitting there. It finally adds tasks about a minute and a half later, long after the first wave of users already saw timeouts. I've watched this exact thing happen on a service that was configured "correctly" by every checklist. The problem was never the policy. It was how often ECS told CloudWatch what was going on.
On June 18, 2026 at AWS Summit New York, AWS shipped the fix: high-resolution metrics for ECS service auto scaling. ECS can now publish utilization metrics every 20 seconds instead of every 60. That one change cut scale-out trigger time from 363 seconds to 86 seconds in AWS's own testing. This guide walks through why the old behavior was slow, what actually changed, and how to turn on high-resolution metrics for your ECS service auto scaling without wrecking your CloudWatch bill.
Why is Amazon ECS auto scaling slow with standard CloudWatch metrics?
ECS auto scaling is slow because standard CloudWatch metrics only arrive once a minute, so the scaler is always reacting to stale data. Application Auto Scaling watches a metric like average CPU, compares it to your target, and adjusts the task count. If that metric updates every 60 seconds, the scaler can be up to a full minute behind reality before it even notices a spike.
Then the delays stack. A target-tracking policy needs a few consecutive breaching data points before it acts, so it does not fire on the first high reading. At 60-second resolution, "a few data points" means several minutes. After the alarm finally trips, ECS still has to place the new tasks, pull images, pass health checks, and register with the load balancer. The metric lag sits on top of all of that.
So teams over-provision to compensate. I've done it myself: run the service at 40% CPU target instead of 65%, keep a fat minimum task count, and eat the cost just so there's enough headroom to survive the minute of blindness. That works, but you're paying for idle capacity to paper over a measurement problem.
What changed with ECS high-resolution metrics?
ECS now publishes service utilization metrics to CloudWatch at 20-second resolution instead of the standard 60-second resolution, so the scaler sees a spike up to three times sooner. AWS introduced two new high-resolution metric types you can target: ECSServiceAverageCPUUtilizationHighResolution and ECSServiceAverageMemoryUtilizationHighResolution.
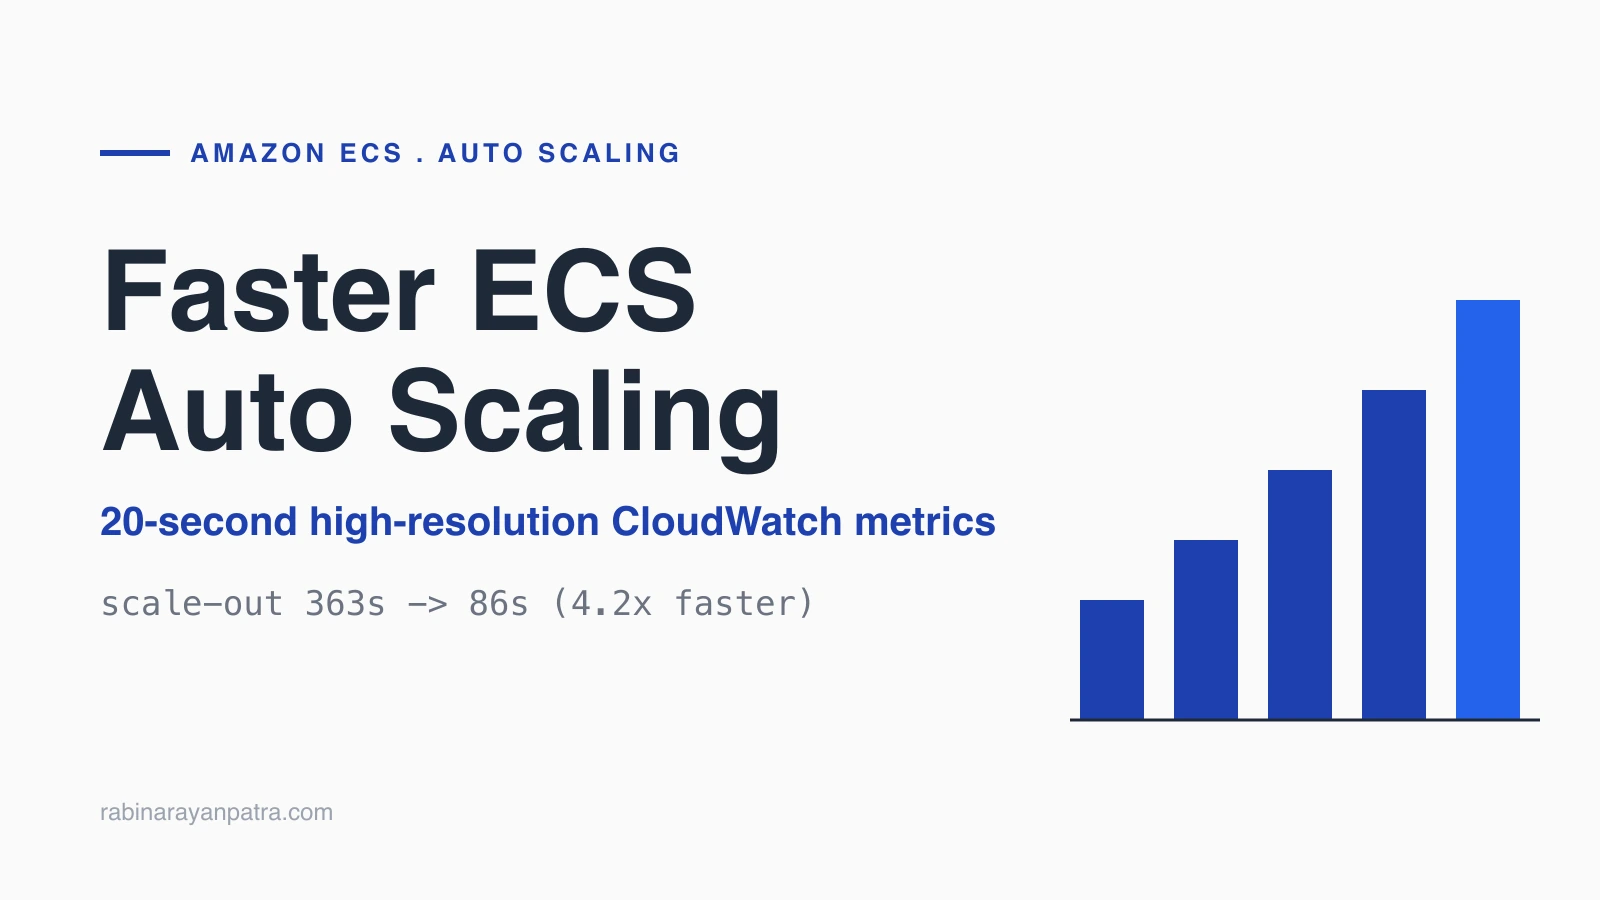
The numbers AWS published are the headline. With high-resolution metrics driving the policy, scale-out trigger time dropped from 363 seconds to 86 seconds, a 76% cut, about 4.2 times faster. End to end, the total time to detect the spike, scale, and provision new tasks fell from 386 seconds to 109 seconds, a 72% cut, roughly 3.5 times faster. That is the difference between users seeing errors and never noticing the spike happened.
It works across all three compute options too: AWS Fargate, ECS Managed Instances, and Amazon EC2. So whether you run serverless tasks on Fargate or pack containers onto EC2, the faster signal is available. It is generally available now, no preview flag, no waitlist.
How do you enable high-resolution metrics for ECS service auto scaling?
High-resolution metrics are opt-in, so you turn them on per service and then point a scaling policy at the new metric. There are two steps: enable 20-second metrics on the service, then wire a target-tracking policy to the high-resolution metric type.
First, enable the metrics. In the ECS console, when you create or update a service, open the Monitoring configuration section and turn on 20-second resolution metrics. The same setting is exposed through the AWS SDKs, the CLI, and CloudFormation. AWS rolled this out on June 18, 2026, so check the current ECS docs for the exact field name in your infrastructure-as-code tool rather than copying a stale snippet from somewhere.
Second, register the service as a scalable target if you have not already:
aws application-autoscaling register-scalable-target \
  --service-namespace ecs \
  --resource-id service/my-cluster/my-service \
  --scalable-dimension ecs:service:DesiredCount \
  --min-capacity 2 \
--max-capacity 20Then attach a target-tracking policy that uses the high-resolution metric. The only real change from a normal target-tracking setup is the PredefinedMetricType:
aws application-autoscaling put-scaling-policy \
  --service-namespace ecs \
  --resource-id service/my-cluster/my-service \
  --scalable-dimension ecs:service:DesiredCount \
  --policy-name cpu-high-res-tracking \
  --policy-type TargetTrackingScaling \
  --target-tracking-scaling-policy-configuration '{
    "TargetValue": 65.0,
    "PredefinedMetricSpecification": {
      "PredefinedMetricType": "ECSServiceAverageCPUUtilizationHighResolution"
    },
    "ScaleOutCooldown": 30,
    "ScaleInCooldown": 120
}'Two things to notice. The cooldowns matter more now. With data arriving every 20 seconds, a short ScaleOutCooldown (30 seconds here) lets the service keep adding tasks while a spike is still climbing, instead of adding a batch and then going quiet for five minutes. Keep ScaleInCooldown longer (120 seconds or more) so you scale in calmly and don't thrash. In the console flow, you pick the same thing under the scaling policy: choose target tracking, then select ECSServiceAverageCPUUtilizationHighResolution or ECSServiceAverageMemoryUtilizationHighResolution as the metric.
That's the whole setup. If you already run target tracking on ECSServiceAverageCPUUtilization, switching to the high-resolution variant is a one-line change to the metric type plus enabling the 20-second metrics on the service.
How much do high-resolution ECS metrics cost?
The ECS feature is free, but high-resolution CloudWatch metrics sit in a separate, pricier CloudWatch pricing dimension, so you pay more per metric than for standard-resolution ones. AWS was clear about this in the launch: enabling 20-second metrics introduces a new pricing dimension. CloudWatch has always charged more for high-resolution data because it stores and serves three times as many data points per minute.
In practice the cost is about scope, not the rate. Turning on high-resolution metrics for two or three spiky, revenue-critical services is a rounding error. Turning it on for every metric on a few hundred services is where it shows up on the bill. I treat it like any other targeted optimization: spend the money where latency during a spike actually costs you, and leave the steady background services on standard 60-second metrics.
A simple rule that has worked for me: if a service has a hard SLA during traffic bursts, or if you've been over-provisioning it just to survive scale-out lag, the high-resolution metric is cheaper than the idle capacity you were buying. If a service scales gently over hours, you will not notice the faster signal, so don't pay for it.
What pitfalls should you watch with 20-second scaling?
The biggest risk is flapping, because faster metrics make a badly tuned policy react badly faster. When the scaler can see changes every 20 seconds, an aggressive target value plus short cooldowns can add and remove tasks in a tight loop. Set a sensible ScaleInCooldown, keep scale-in conservative, and let scale-out be the fast path.
Watch your min-capacity and max-capacity bounds too. Faster scaling means you can hit your ceiling sooner during a real spike, so a max-capacity you set conservatively last year might now cap you right when traffic is climbing. Reaching the limit faster is better than reaching it late, but only if the limit is high enough to matter.
And remember the rest of the cold-start chain. High-resolution metrics fix the detection delay, not image pull time, container startup, or load balancer health-check intervals. If your tasks take 90 seconds to become healthy, shaving the metric lag helps, but tuning your health check interval and healthy threshold and slimming your image still matters. Faster sensing only pays off when the work behind it is also quick.
Should you turn high-resolution metrics on everywhere?
No, and that's the honest answer that keeps your bill sane. High-resolution metrics for ECS service auto scaling are one of those small platform changes that quietly fixes a problem teams have been working around for years, but they are a targeted tool, not a default. Turn them on for the services where a minute of blindness costs you users or money, tune the cooldowns, and leave the calm services alone.
What I like most is that this removes a reason to over-provision. For a long time the safe answer to "ECS scales too slowly" was "run more idle tasks." Now the answer can be "react faster and run leaner," which is the better trade for both reliability and cost. If you've ever stared at a flat task count during a spike and wondered why nothing was happening, this is the knob you were missing.
For the full details, see the AWS announcement on ECS high-resolution metrics and the AWS Summit New York 2026 announcement roundup.
Keep Reading
- Postgres Connection Pool Sizing: How PgBouncer Saved My Launch. Scaling tasks fast is pointless if your database connections become the new bottleneck.
- How to Migrate from Ingress NGINX After Kubernetes Retired It. Another infra default that quietly changed and forced teams to retune.
- The One System Design Question That Failed 80% of Candidates in 2025. Why reacting to load is a system design problem, not just a config flag.